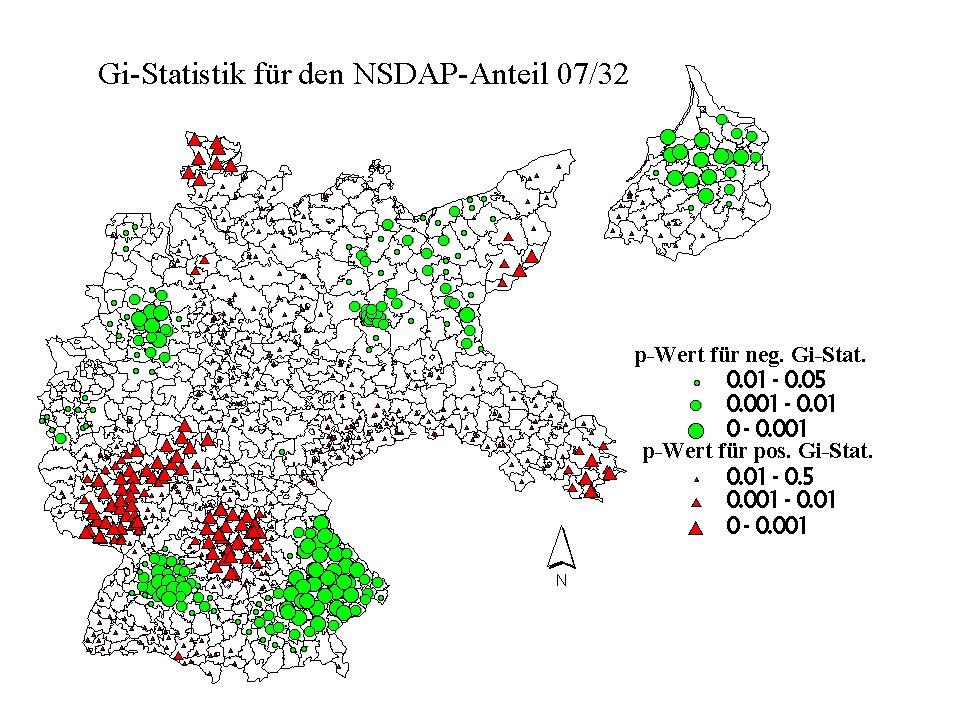
This map shows the p-values of the Gi-Statistic for the NDSAP vote
in 07/1932. Red triangles indicate regional clusters with a high statistical
probability (increasing with size) that a Kreis is surrounded by Kreise
with an overproportionate NSDAP share (compared to the mean for the whole
Reich). Green circles indicate regional clusters with a high statistical
probability tha a Kreis is sourounded by Kreise with an underporportionate
NSDAP share.