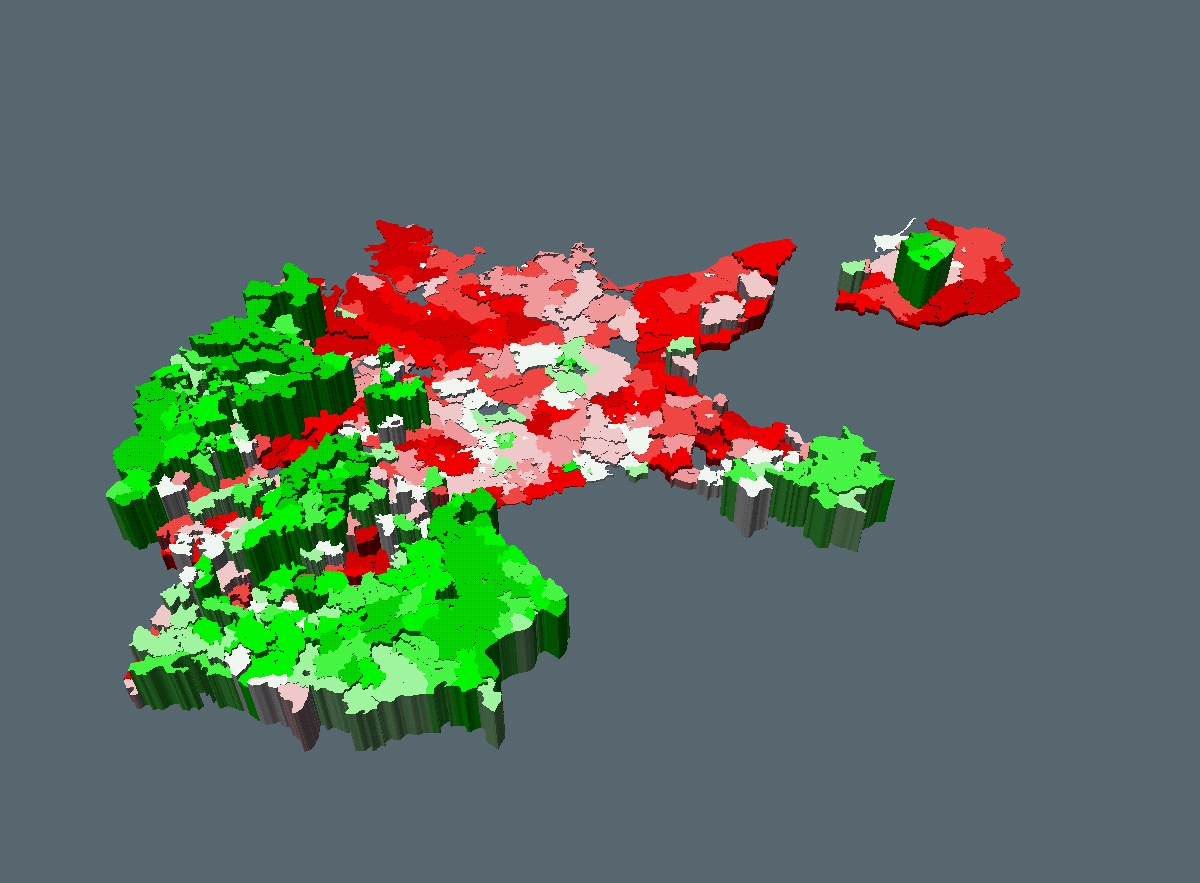
This map shows the influence of religious conviction on the Nazi
vote for the Reichstag election 7/32. Elevation represents the share of
catholics / protestants (the higher, the more catholics live in a Kreis)
in relation to total population. The Nazi vote share is represented by
different colour shadings (dark red: highest NSDAP share; light green:
lowest NSDAP share). The map reveals that the NSDAP strongholds are clearly
restricted to protestant areas. This becomes very clear e.g. in East Prussia,
where in a small catholic enclave the NSDAP performed very poorly in comparison
to the surrounding Kreise dominated by protestants.